Differentially Expressed Genes with P-Value < 5%.
previous
| Gene |
P-value |
Adjst. P-Value |
LogFC |
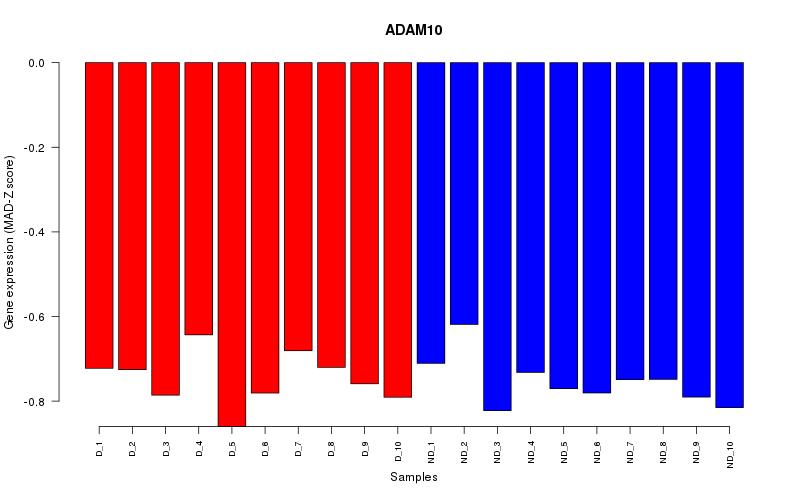
| ADAM10 | 0.014054405 | 0.961511405 | -0.065290827 |
| ADH1B | 0.032522032 | 0.961511405 | -0.400600934 |
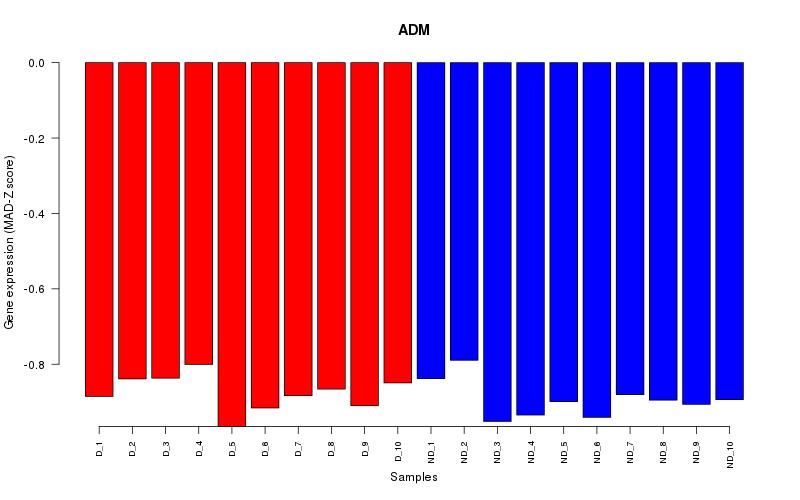
| ADM | 0.03685035 | 0.961511405 | -0.157317029 |
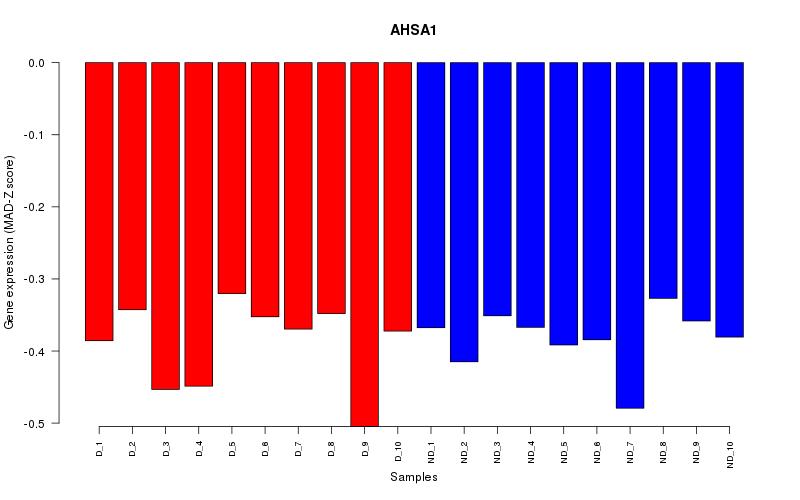
| AHSA1 | 0.03230957 | 0.961511405 | 0.081917389 |
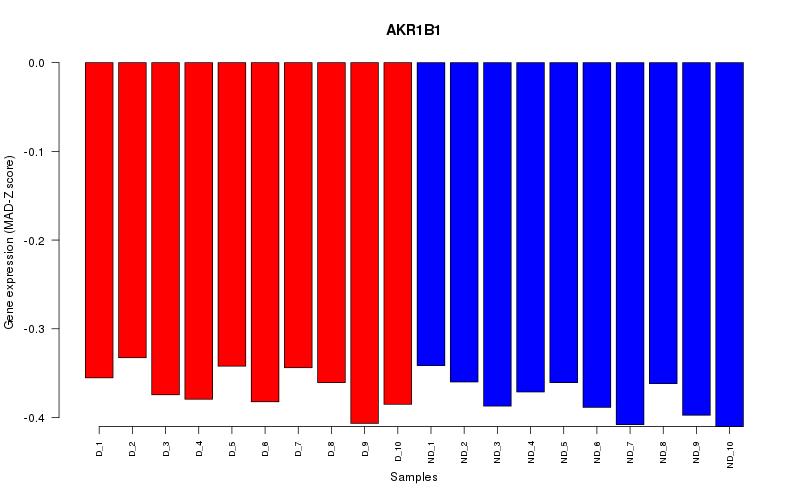
| AKR1B1 | 0.045357908 | 0.961511405 | -0.06009112 |
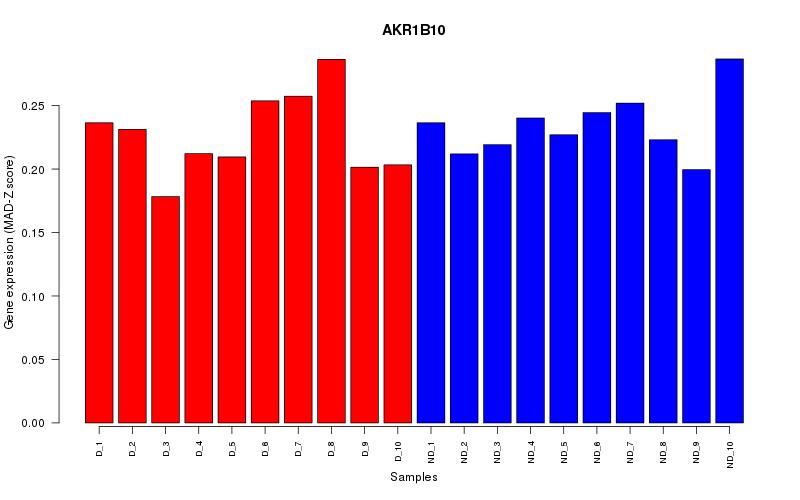
| AKR1B10 | 0.026707028 | 0.961511405 | -0.065117439 |
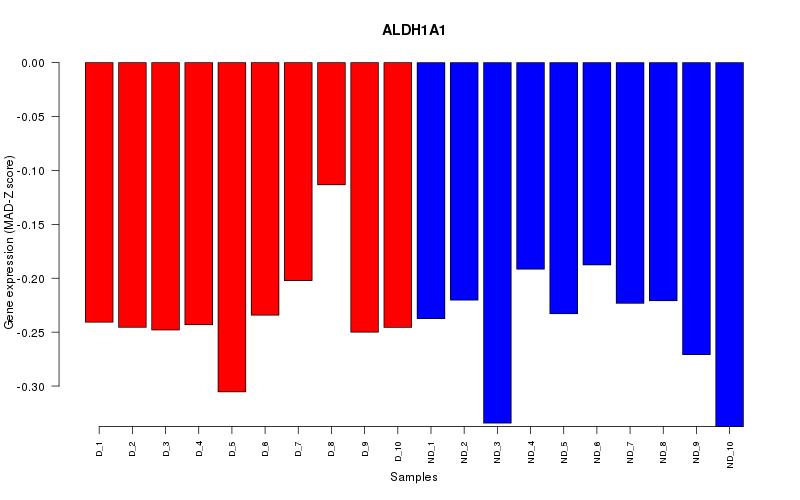
| ALDH1A1 | 0.028313934 | 0.961511405 | 0.142867734 |
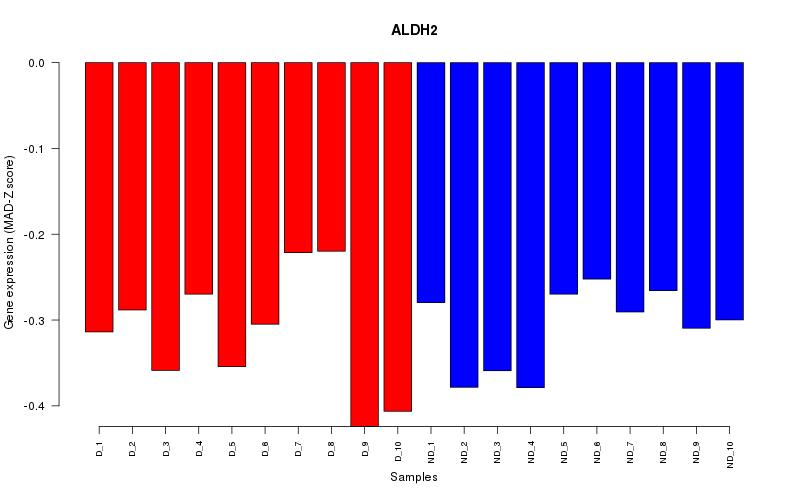
| ALDH2 | 0.016875485 | 0.961511405 | -0.124096278 |
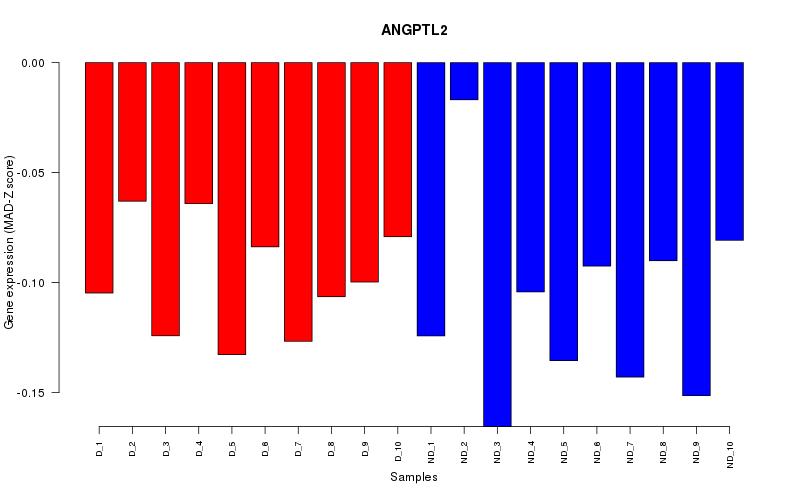
| ANGPTL2 | 0.027592038 | 0.961511405 | -0.229577503 |
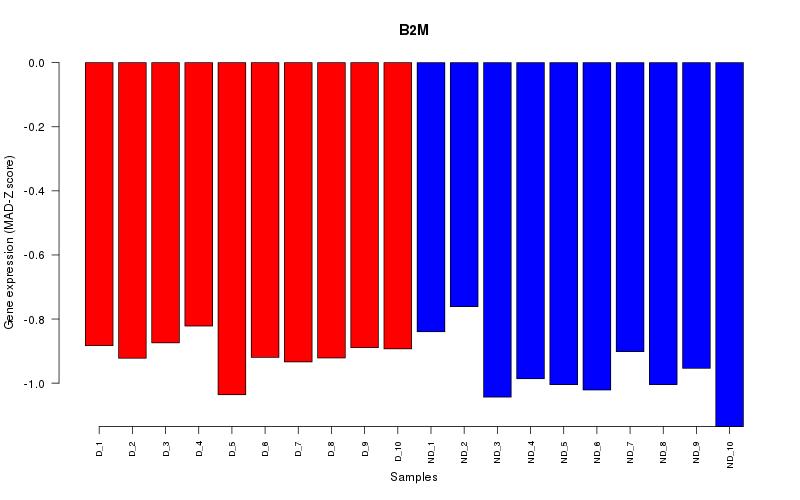
| B2M | 0.023101657 | 0.961511405 | -0.079993898 |
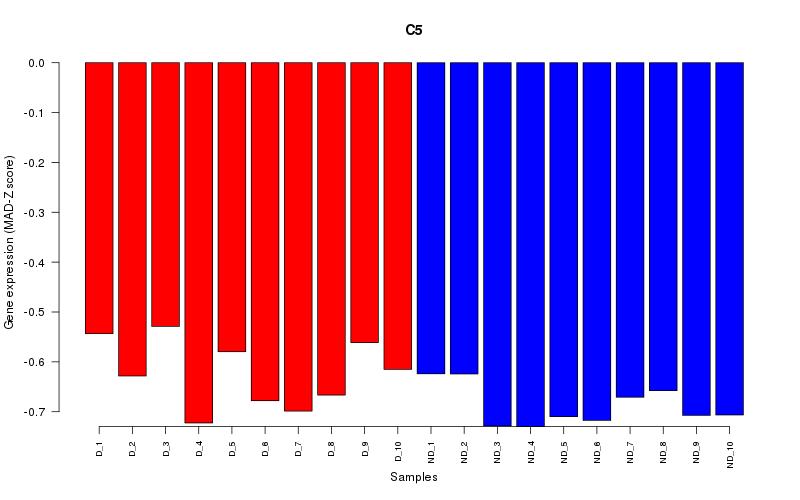
| C5 | 0.01679802 | 0.961511405 | -0.065397722 |
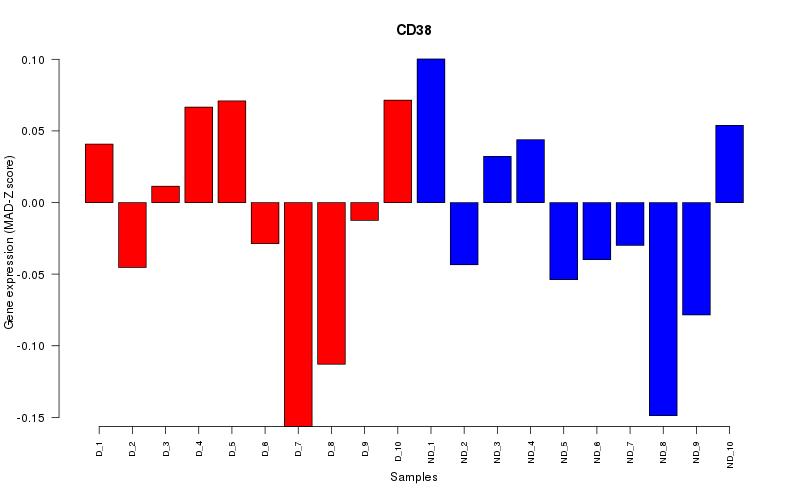
| CD38 | 0.0435242 | 0.961511405 | -0.036264161 |
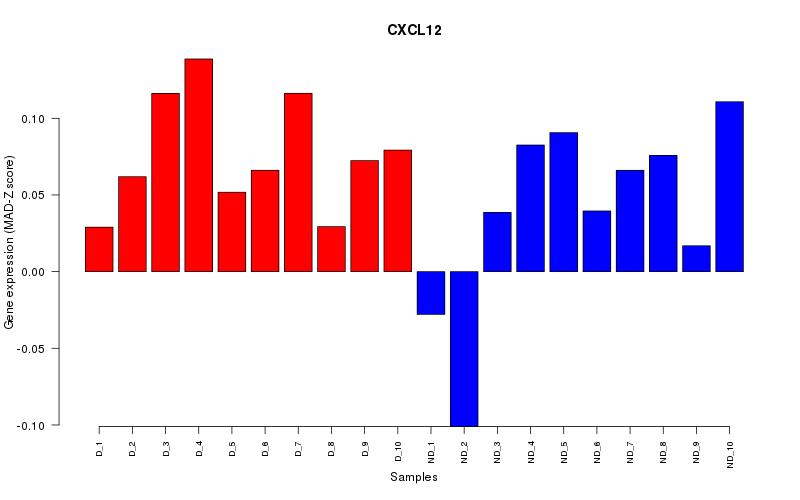
| CXCL12 | 0.015077534 | 0.961511405 | -0.249683715 |
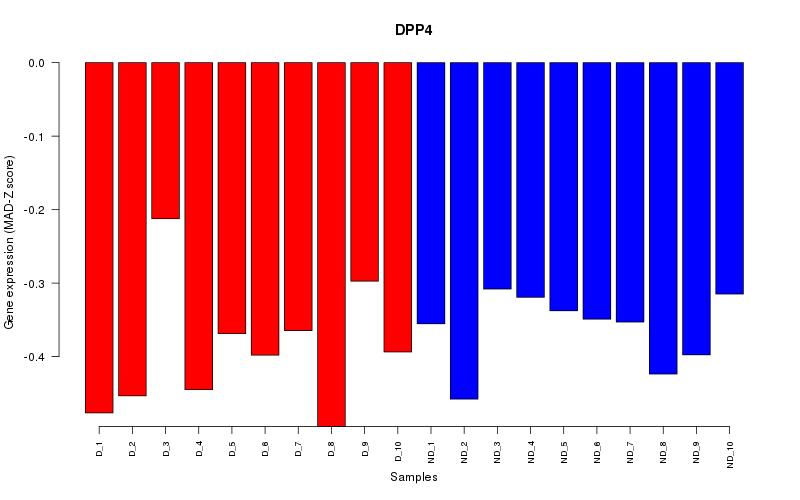
| DPP4 | 0.040491865 | 0.961511405 | -0.190851415 |
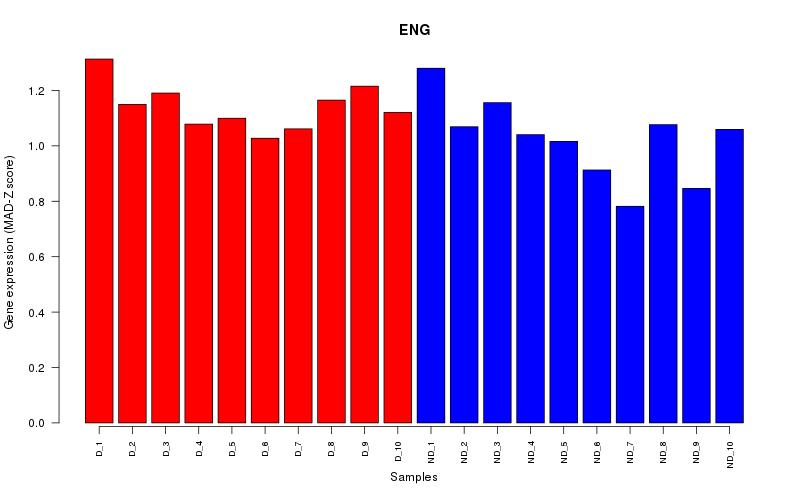
| ENG | 0.027177101 | 0.961511405 | -0.118187073 |
| ENPP2 | 0.014662044 | 0.961511405 | -0.11188284 |
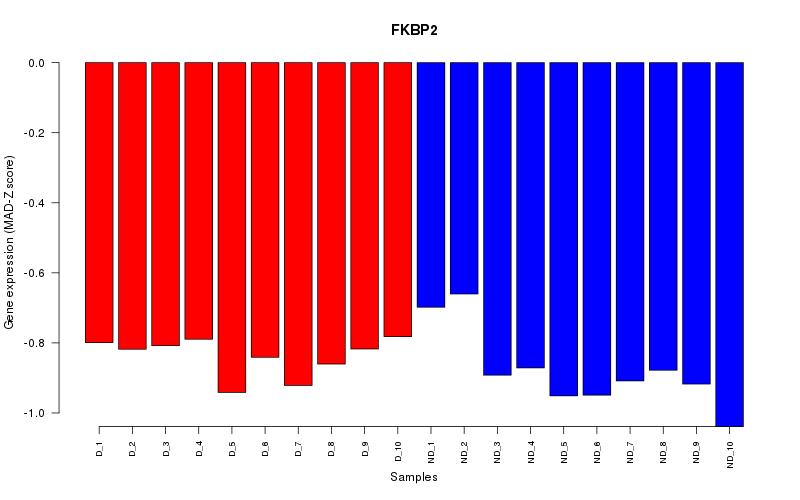
| FKBP2 | 0.049250644 | 0.961511405 | 0.12501056 |
| GAS1 | 0.003402416 | 0.961511405 | -0.145078418 |
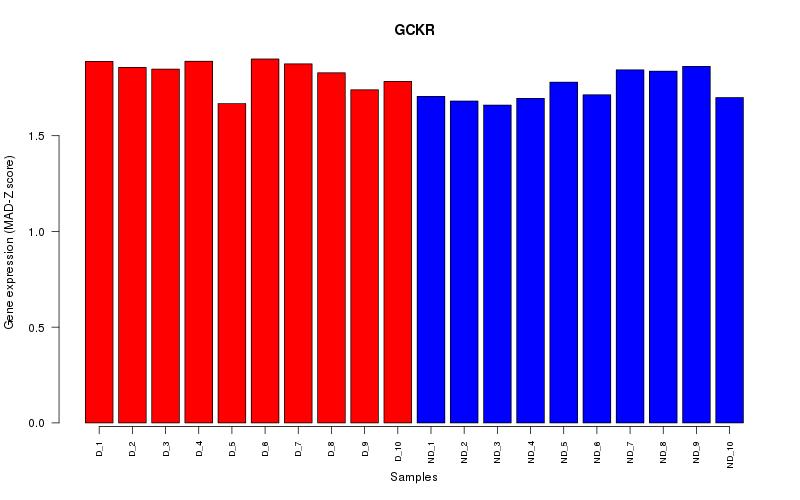
| GCKR | 0.023637553 | 0.961511405 | 0.041094394 |
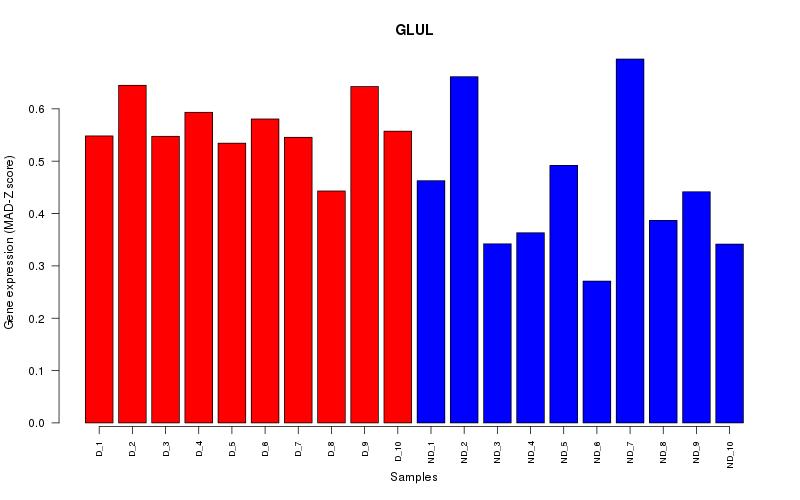
| GLUL | 0.015280831 | 0.961511405 | -0.118029563 |
| GPC5 | 0.018214277 | 0.961511405 | -0.097123404 |
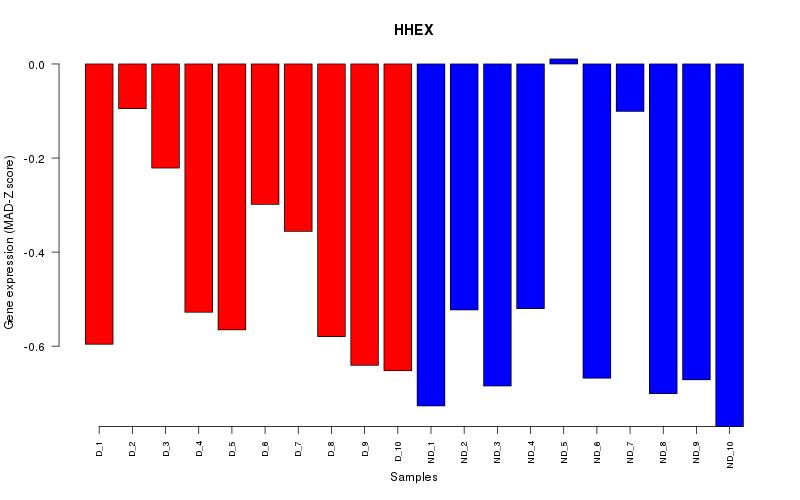
| HHEX | 0.036463928 | 0.961511405 | -0.045562802 |
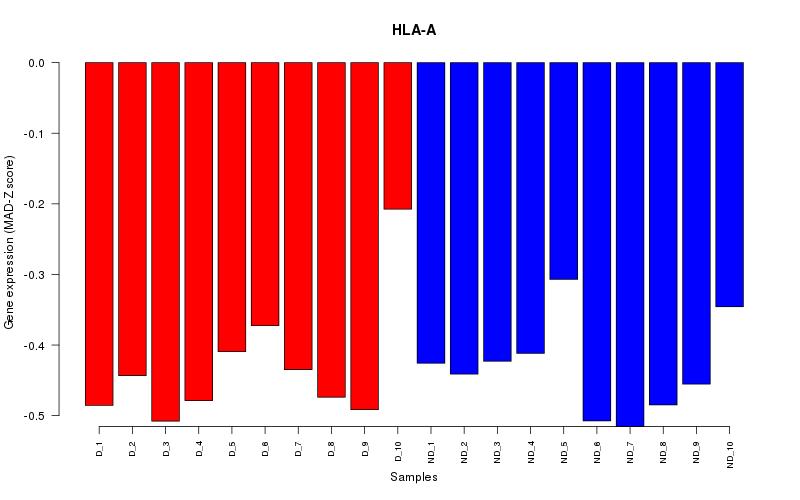
| HLA-A | 0.011141861 | 0.961511405 | -0.096962867 |
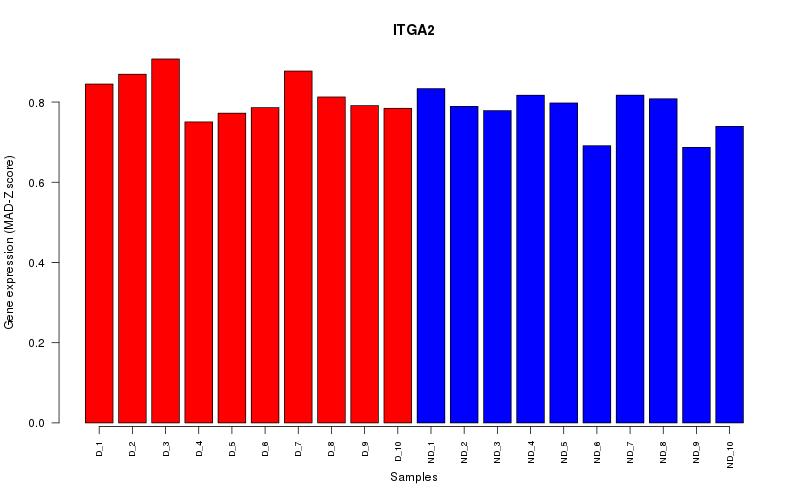
| ITGA2 | 0.028803166 | 0.961511405 | 0.064138337 |
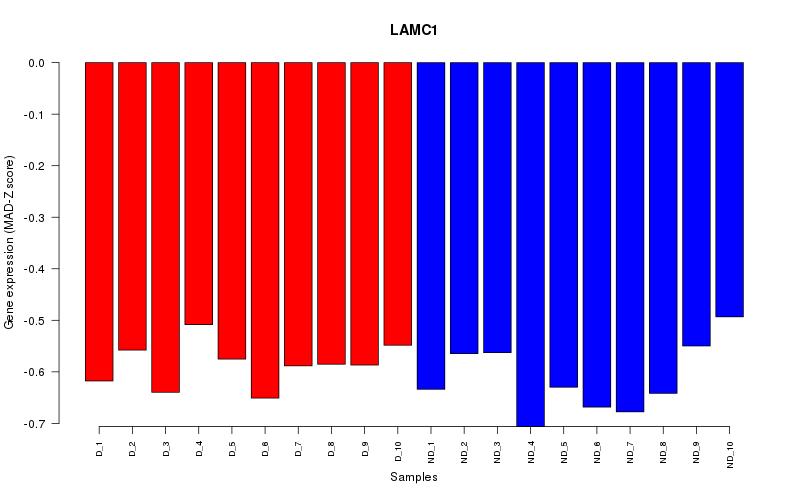
| LAMC1 | 0.02156521 | 0.961511405 | -0.106882389 |
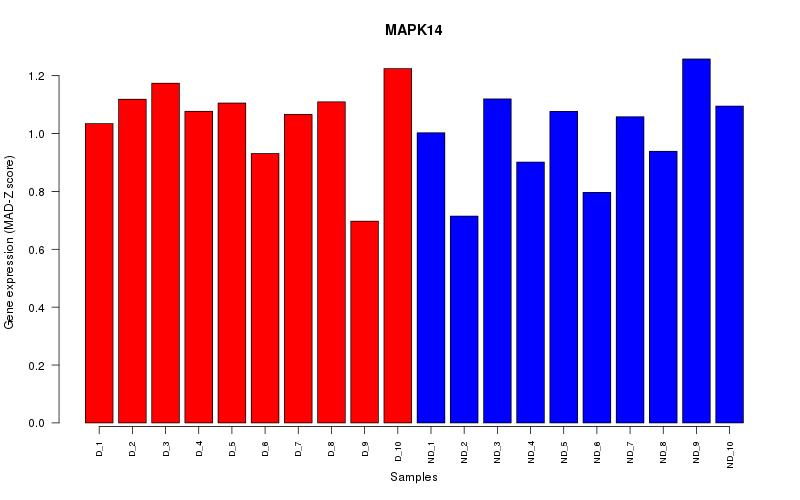
| MAPK14 | 0.047385027 | 0.961511405 | -0.046037785 |
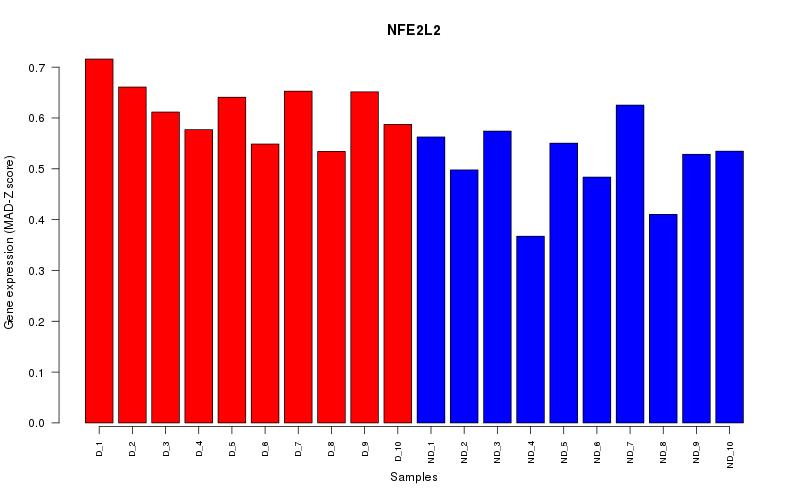
| NFE2L2 | 0.001955712 | 0.961511405 | -0.104573858 |
| NOV | 0.021693913 | 0.961511405 | -0.150394903 |
| NPPA | 0.004718244 | 0.961511405 | 0.062218443 |
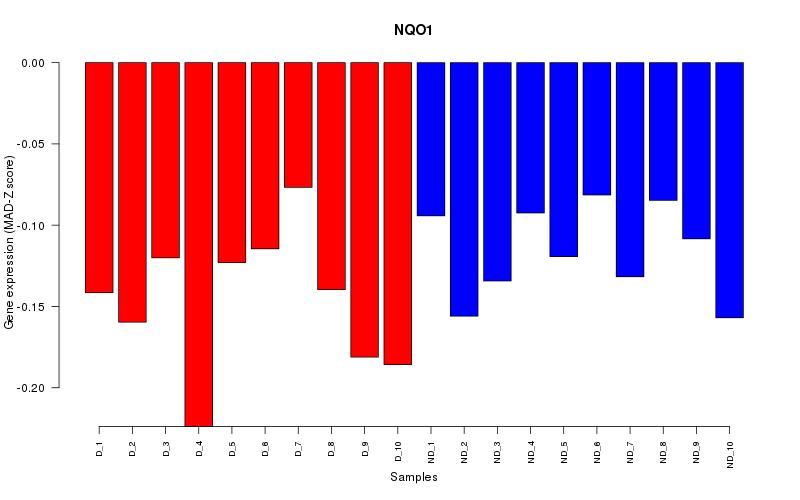
| NQO1 | 0.01855786 | 0.961511405 | -0.10249159 |
| PDGFA | 0.042929438 | 0.961511405 | 0.05362505 |
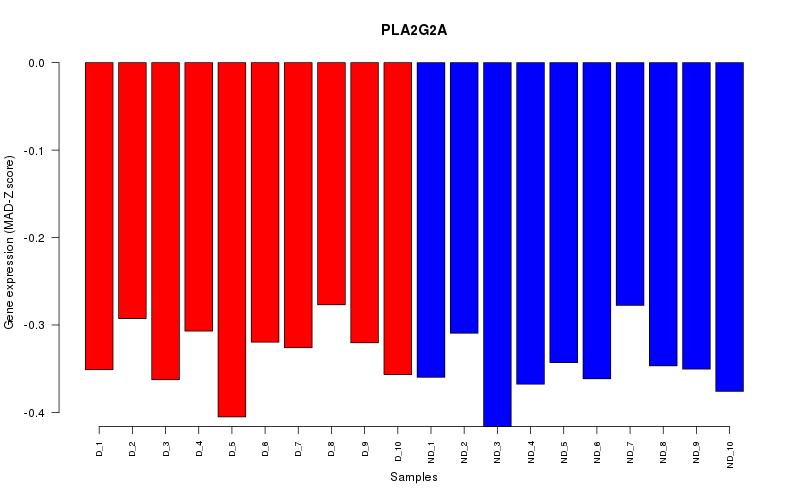
| PLA2G2A | 0.039445681 | 0.961511405 | -0.139917756 |
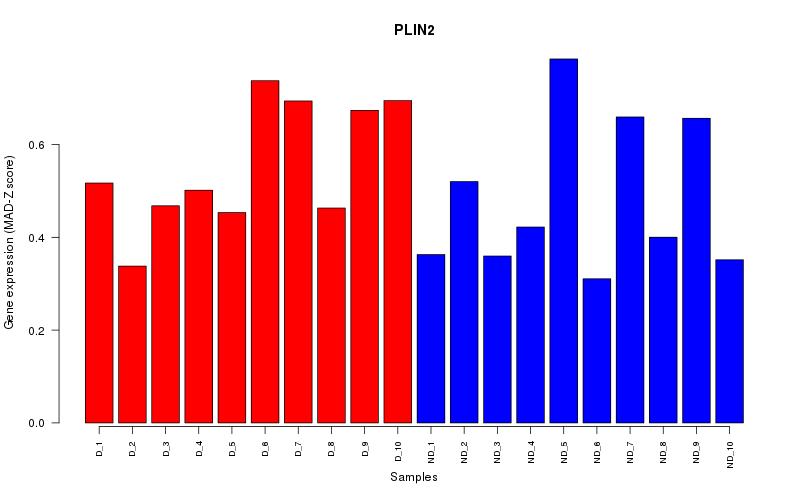
| PLIN2 | 0.010079726 | 0.961511405 | -0.165009244 |
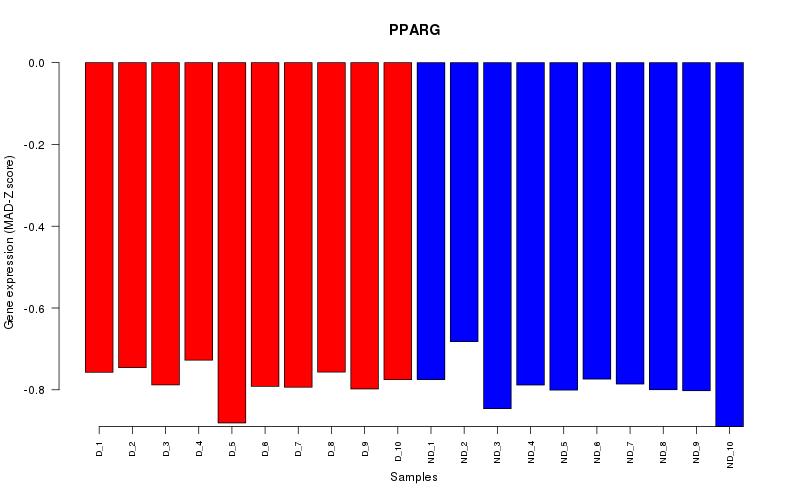
| PPARG | 0.008694894 | 0.961511405 | -0.117013511 |
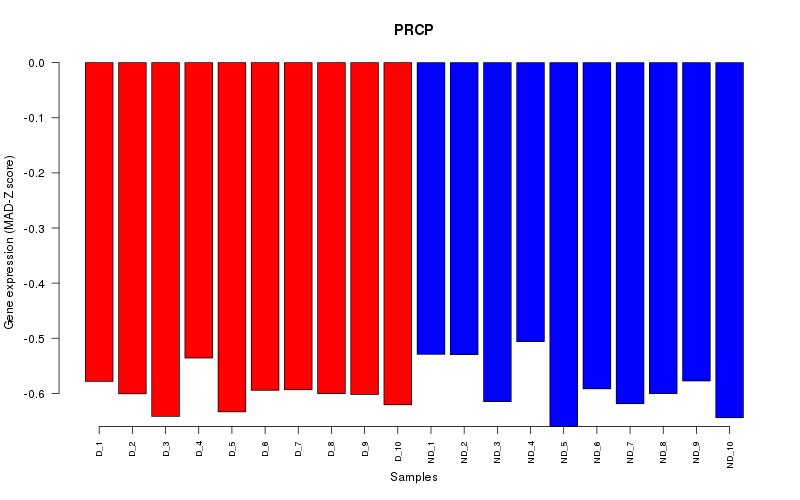
| PRCP | 0.020062522 | 0.961511405 | -0.133009102 |
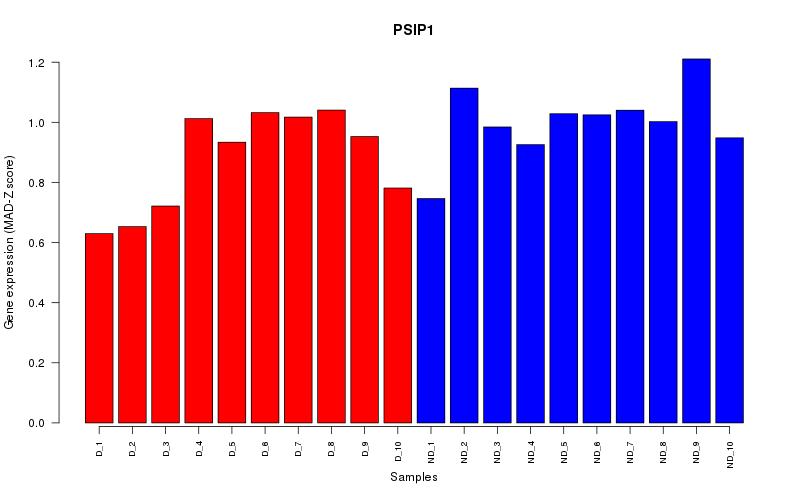
| PSIP1 | 0.016048094 | 0.961511405 | -0.110987255 |
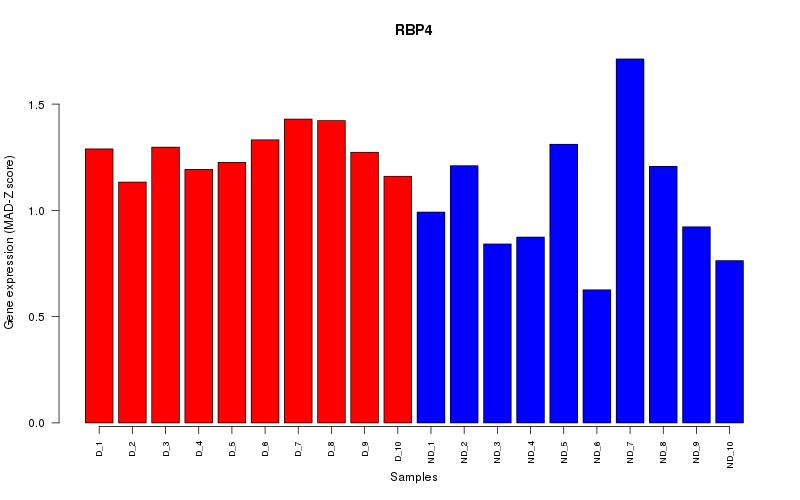
| RBP4 | 0.037036563 | 0.961511405 | -0.166925128 |
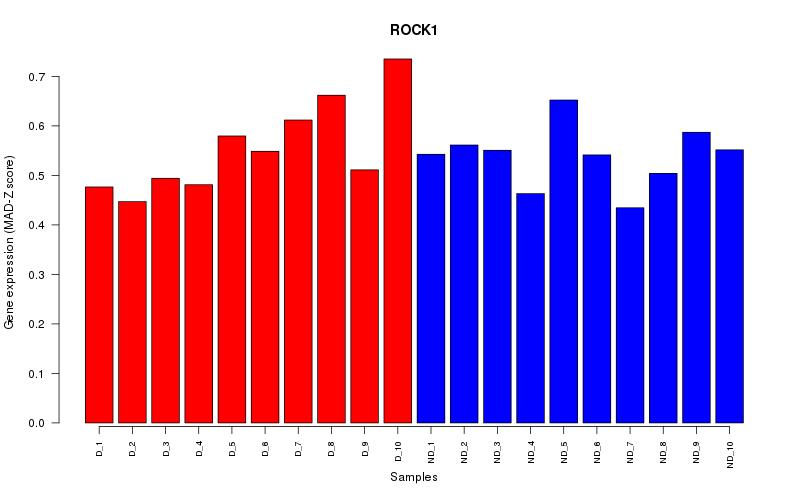
| ROCK1 | 0.042907745 | 0.961511405 | -0.050495109 |
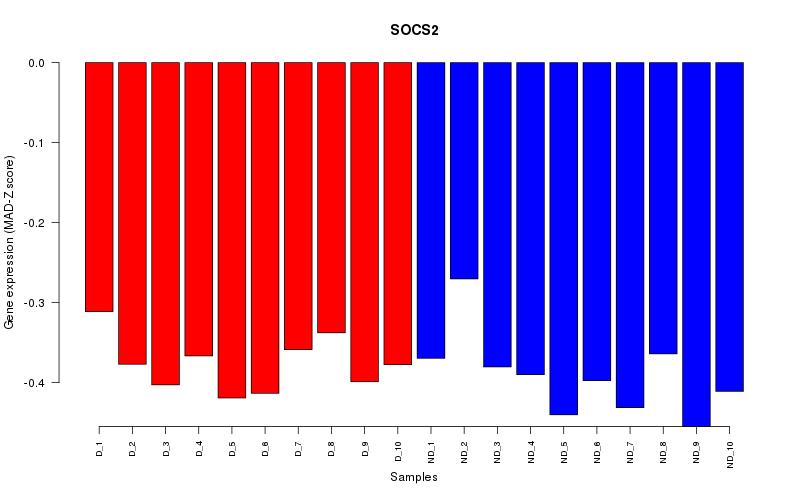
| SOCS2 | 0.030260711 | 0.961511405 | -0.066126692 |
| SPP1 | 0.043898288 | 0.961511405 | 0.174161539 |
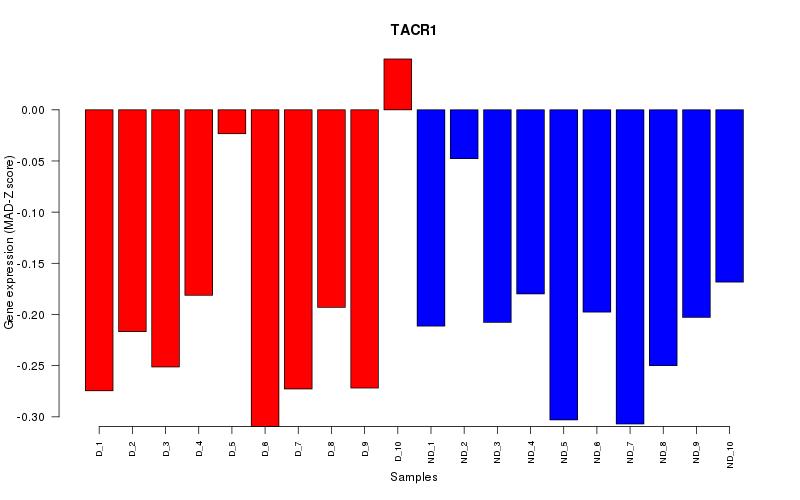
| TACR1 | 0.018199779 | 0.961511405 | -0.040702941 |
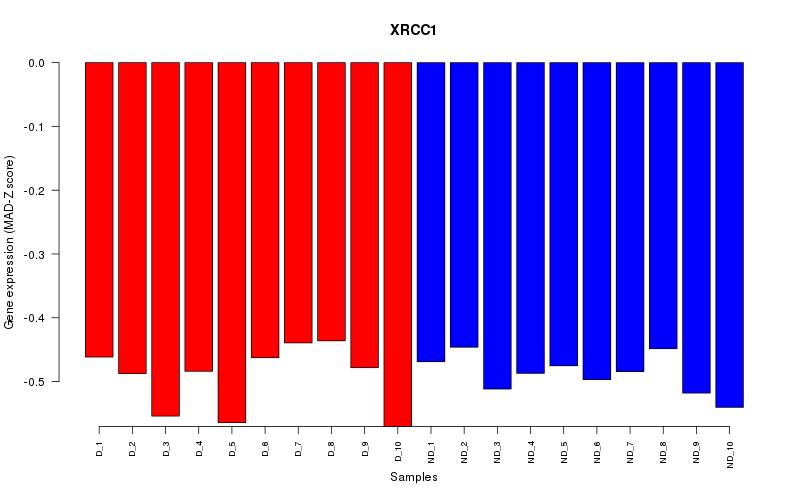
| XRCC1 | 0.01663749 | 0.961511405 | -0.047917521 |
GSE12643: Transcription profiling of myotubes from patients with type 2 diabetes.
Samples: Skeletal muscle samples were obtained from 10 subjects with type 2 diabetes and 10 subjects without type 2 diabetes.
